ThermodynamicsHard
Question
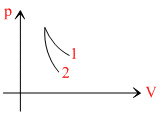
p-V plots for two gases during adiabatic processes are shown in the figure. Plots 1 and 2 should correspond respectively to
Options
A.He and O2
B.O2 and He
C.He and Ar
D.O2 and N2
Solution
In adiabatic process
slope of p-V graph,
slope ∝ γ [with negative sign]
From the given graph,
(slope)2 > (slope)1
∴ γ2 > γ1
Therefore, 1 should corresponding to O2 (γ = 1.14) and 2 should correspond to He (γ = 1.67).
slope of p-V graph,
slope ∝ γ [with negative sign]
From the given graph,
(slope)2 > (slope)1
∴ γ2 > γ1
Therefore, 1 should corresponding to O2 (γ = 1.14) and 2 should correspond to He (γ = 1.67).
Create a free account to view solution
View Solution FreeMore Thermodynamics Questions
A system does 50 J of work under adiabatic condition. In this process :-...Steam at 100o C is passes into 1.1 kg of water contained in a calorimeter of water equivalent 0.02 kg at 15oC till the t...If an ideal flask containing hot coffee is shaken, the temperature of the coffee will :...A bimetallic strip is formed out of two identical strips - one of copper and the other of brass. The coefficients of lin...The work done in the expansion of a gas from a volume 10 cm3 to 20 cm3 in an isobaric process at one atmospheric pressur...