Atomic StructureHard
Question
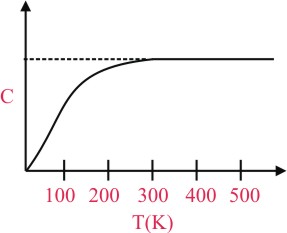
The figure below shows the variation of specific heat capacity (C) of a solid as a function of temperature (T). The temperature is increased continuously from 0 to 500 K at a constant rate. Ignoring any volume change, the following statement(s) is (are) correct to a reasonable approximation :-
Options
A.the rate at which heat is absorbed in the range 0-100 K varies linearly with temperature T.
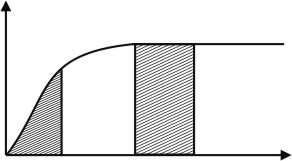
B.heat absorbed in increasing the temperature from 0-100 K is less than the heat required for increasing the temperature from 400-500 K.
C.there is no change in the rate of heat absorption in the range 400-500 K
D.the rate of heat absorption increases in the range 200-300 K
Solution
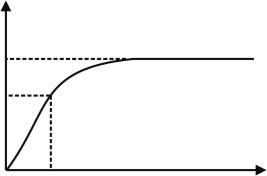
(A) From 0 to 100 K the major part of graph lies in linear region and very small part in non-linear region, therefore to a reasonable approximation between 0 K - 100 K, graph of C vs T is linear.
(B) by comparing area under curve
(C) from 400 K to 500 K, Graph of C vs T become asymptotic hence rate of heat absorption become constant
(D) The rate of heat absorption increases as C is increasing.
(B) by comparing area under curve
(C) from 400 K to 500 K, Graph of C vs T become asymptotic hence rate of heat absorption become constant
(D) The rate of heat absorption increases as C is increasing.
Create a free account to view solution
View Solution FreeMore Atomic Structure Questions
Beryllium fourth electron will have the four quantum numbers :-...Maximum number of electrons in a subshell with l = 3 and n = 4 is:...In which transition, one quantum of energy is emitted ?...Which of the following has the maximum number of unpaired electrons ?...One mole of a monoatomic real gas satisfied the equation p(V− b) = RT where b is a constant. Therelationship of in...