CalorimetryEasy
Question
A block of ice at -10oC is slowly heated and converted to steam at 100oC. Which of the following curves represents the phenomena qualitative ?
Options
A.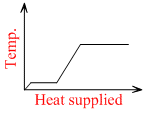
B.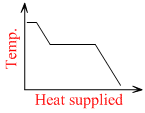
C.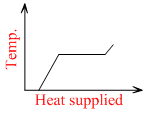
D.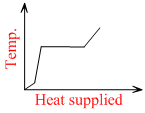
Solution
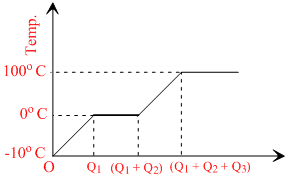
The temperature of ice will first increase from -10o C to 0o C.
Heat supplied in this process will be
Q1 = msi (10)
Where, m = mass of ice
si = specific heat of ice
Then, ice start melting. Temperature during melting will remain constant (0o C).
Heat supplied in this process will be
Q3 = msw(100)
Where, sw = specific heat of water
Finally, water at 100o C will be converted into steam at 100o C and during this process temperature again remains constant. Temperature versus heat supplied graph will be as shown in figure.
Create a free account to view solution
View Solution FreeMore Calorimetry Questions
A quantity of heat requirad to change the unit mass of a solid substance to its liquid state, while the temperature rema...The temperature of a body rises by 44oC when a certain of heat is given t it. The same heat when supplied to 22 g of ice...When two samples at different temperature are mixed, the temperature of the mixture can be : -...20 gm of Ice at - 10oC added to 10 gm of water at 100oC. Than final temp. of the mixture is:-...Which of the following best represents the temperature versus heat supplied graph for water, in the range of $- 20^{\cir...