ThermodynamicsEasy
Question
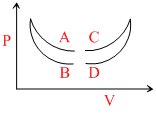
Four curves A, B, C and D are drawn in the adjoining figure for a given amount of gas. The curves which represent adiabatic and isothermal changes are :-
Options
A.C and D respectively
B.D and C respectively
C.A and B respectively
D.B and A respectively
More Thermodynamics Questions
During the melting of a slab of ice at 273 K at atomospheric pressure...In an adiabatic process on a gas with g = 1.4, the pressure is increased by 0.5%. The volume decreases by about...If the quantity of energy with drawn from a system is δQ, work done by the system δW and the increase in inter...Let P1 and P2 be the final pressure of the samples 1 and 2 respectively in the previous question then :...The volume of a gas is reced adiabatically to (1/4) of its volume at 27oC. If γ = 1.4.The new temrereacture will be...