Photoelectric EffectHard
Question
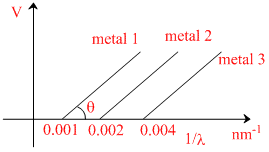
The graph between 1/λ and stopping potential (V) of three metals having work functions φ1, φ2 and φ3 in an experiment of photo-electric effect is plotted as shown in the figure. Which of the following statement(s) is/are correct? [Here λ is the wavelength of the incident ray].
Options
A.Ratio of work functions φ1 : φ2 : φ3 = 1 : 2 : 4
B.Ratio of work functions φ1 : φ2 : φ3 = 4 : 2 : 1
C.tan θ is directly proportional to hc/e, where h is Planck′s constant and c is the speed of light.
D.The violet colour light can eject photoelectrons from metals 2 and 3.
Solution
 - φ = eV
V =

For plate 1: plate 2 plate 3
 = 0.001
  = 0.002
  = 0.004
φ1 : φ2 : φ3 = 1 : 2 : 3
For plate 2, threshold wavelength
λ =
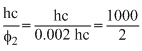 = 500 nm
For plate 3, threshold wavelength
λ =
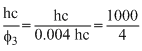 = 250 nm
 Since violet colour light λ is 400 nm, so λviolet < λthreshold for plate 2
So, violet colour light will eject photo-electrons from plate 2 and not from plate 3.
Create a free account to view solution
View Solution FreeMore Photoelectric Effect Questions
Which of the following is true for photon :-...What is the approximate ratio of wavelength of radiation and when atomic number of first target is Z1 = 64 and atomic no...If λmin is minimum wavelength produced in X-ray tube and λkα is the wavelength of kα line. As the op...Two separate monochromatic light beams A and B of the same intensity (energy per unit area per unit time) are falling no...Two photons each of 2.5 eV energy are incident on a metal surface of work function 4.5 eV then:...