JEE Advanced | 2013Heat TransferHard
Question
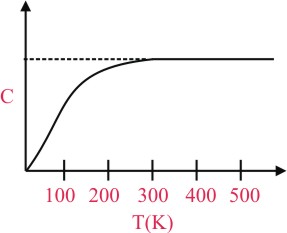
The figure below shows the variation of specific heat capacity (C) of a solid as a function of temperature (T). The temperature is increased continuously from 0 to 500 K at a constant rate. Ignoring any volume change, the following statement(s) is (are) correct to a reasonable approximation :-
Options
A.the rate at which heat is absorbed in the range 0-100 K varies linearly with temperature T.
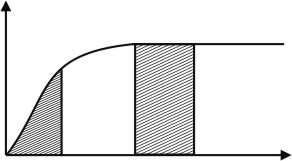
B.heat absorbed in increasing the temperature from 0-100 K is less than the heat required for increasing the temperature from 400-500 K.
C.there is no change in the rate of heat absorption in the range 400-500 K
D.the rate of heat absorption increases in the range 200-300 K
Solution
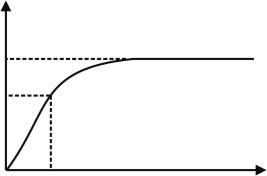
(A) From 0 to 100 K the major part of graph lies in linear region and very small part in non-linear region, therefore to a reasonable approximation between 0 K - 100 K, graph of C vs T is linear.
(B) by comparing area under curve
(C) from 400 K to 500 K, Graph of C vs T become asymptotic hence rate of heat absorption become constant
(D) The rate of heat absorption increases as C is increasing.
(B) by comparing area under curve
(C) from 400 K to 500 K, Graph of C vs T become asymptotic hence rate of heat absorption become constant
(D) The rate of heat absorption increases as C is increasing.
Create a free account to view solution
View Solution FreeMore Heat Transfer Questions
A black body is at a temperature of 5760 K. The energy of radiation emitted by the body at wavelength 250nm is U1, at wa...The cause of Fraunhoffer′s lines is...A radiation of energy ′E′ falls normally on a perfectly reflecting surface. The momentum transferred to the ...Two metal rods, 1 & 2 of same length have same temp difference between their ends, their thermal conductivities are K1 &...An irregular rod of same uniform material as shown in figure is conducting heat at a steady rate. The temperature gradie...