Organisms and PopulationHard
Question
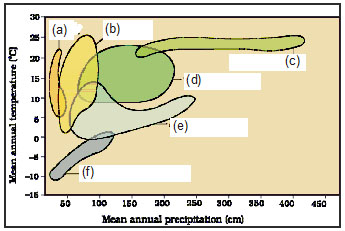
Following graph shows biome distribution with respect to annual temperature and precipitation:
Options
A.(a) Desert, (b) Grassland, (c) Tropical forest, (d) Temperate forest, (e) Coniferous forest, (f) Arctic and alpine
B.(a) Grassland, (b) Desert, (c) Tropical forest, (d) Temperate forest, (e) Coniferous forest, (f) Arctic and alpine
C.(a) Desert, (b) Grassland, (c) Temperate forest, (d) Tropical forest, (e) Coniferous forest, (f) Arctic and alpine
D.(a) Desert, (b) Grassland, (c) Tropical forest, (d) Temperate forest, (e) Coniferous forest (f) Arctic & alpine tundra,