Current Electricity and Electrical InstrumentHard
Question
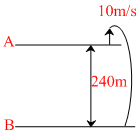
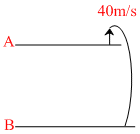
Two stones are thrown up simultaneously from the edge of a cliff 240 m high with initial speed of 10 m/s and 40 m/s respectively. Which of the following graph best represents the time variation of relative position of the second stone with respect to the first ? (Assume stones do not rebound after hitting the ground and neglect air resistance, take g = 10 m/s2) (The figure are schematic and not drawn to scale)
Options
A.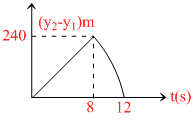
B.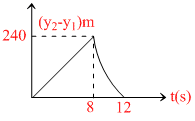
C.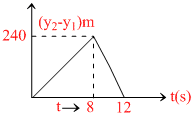
D.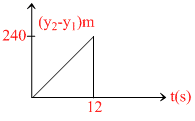
Solution
For particle 1
- 240 = + 10t - gt2
gt2
5t2 - 10t - 240 = 0
t1 = 8 sec
For particle 2
- 240 = 40t - gt2
gt2
5t2 - 40t - 240 = 0
t2 = 12 sec
for 0 < t < 8 sec → arel = 0
straight line x-t graph
for 8 < t < 12 sec → arel = - g
downward parabola
for t > 12 sec → Both particles comes to rest
- 240 = + 10t -
gt25t2 - 10t - 240 = 0
t1 = 8 sec
For particle 2
- 240 = 40t -
gt25t2 - 40t - 240 = 0
t2 = 12 sec
for 0 < t < 8 sec → arel = 0
straight line x-t graph
for 8 < t < 12 sec → arel = - g
downward parabola
for t > 12 sec → Both particles comes to rest
Create a free account to view solution
View Solution FreeTopic: Current Electricity and Electrical Instrument·Practice all Current Electricity and Electrical Instrument questions
More Current Electricity and Electrical Instrument Questions
The reading of voltmeter is...Six cells each of emf 1V and internal resistance 1Ω are connected as shown in fig. Current through the cells is :-...10,000 electrons are passing per minute through a tube of radius 1cm. The resulting current is :...A battery of emf E and internal resistance r is connected across a resistance R. Resistance R can be adjusted to any val...In the given potentiometer circuit, the resistance of the potentiometer wire AB is R0. C is a cell of internal resistanc...