Breathing and Exchange of GasesEasy
Question
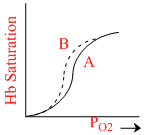
On the accompanying graph, the shift from curve-A to curve-B could be caused by :-
a. Foetal heamoglobin (HbF)
b. CO poisoning
c. Increased PCO2
d. Increased temperature
e. Decreased pH
a. Foetal heamoglobin (HbF)
b. CO poisoning
c. Increased PCO2
d. Increased temperature
e. Decreased pH
Options
A.a only
B.a and b
C.a, b and c
D.a, b, c and e
More Breathing and Exchange of Gases Questions
Maximum amount 70-75% of carbon dioxide transport occurs as...What is the amount of air which is inspire or expire per minute by a healthy man....Which one of the following is the correct statement for respiration in humans ?...Which of the following gases makes the most stable combination with the haemoglobin of red blood cells ?...In alveoli of the lungs, the air at the site of gas exchange, is separated from the blood by...